X-ecuters
QDS Hackathon 2023:
Turning Data into Insights

QDS Hackathon 2023:
Turning Data into Insights

B. Tech, CST
hidden text

BCIT, Full-Stack Web Development
hidden text

BCIT, CST

BCIT, Applied Web Development
hidden text

BCIT, Full-Stack Web Development
hidden text

BCIT, CST
For a mining operation, find ways to move the same amount of material from the shovels to dumps with the least amount of fuel consumed.
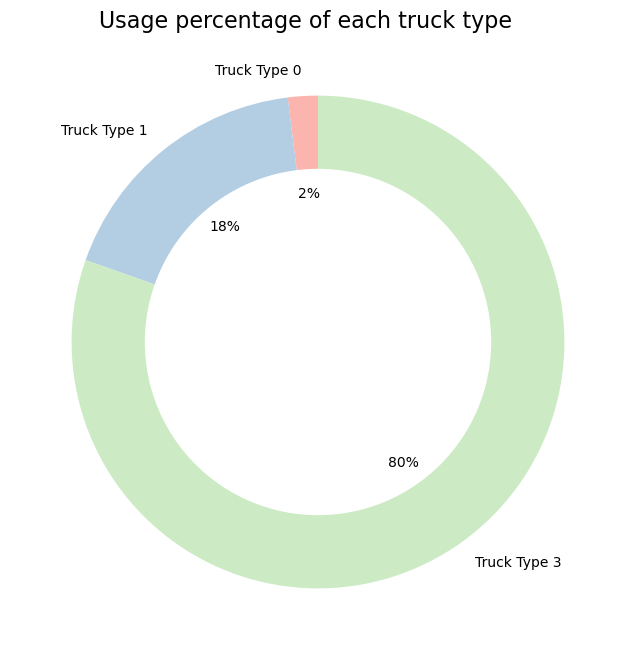
After pre-processing the given data, only Truck Types 0, 1, and 3 remain. It is assumed that Truck Types 2 and 4 had sensor errors or only produced invalid (null) data.
Out of the remaining three truck types, Truck Type 3 was the most frequently used.
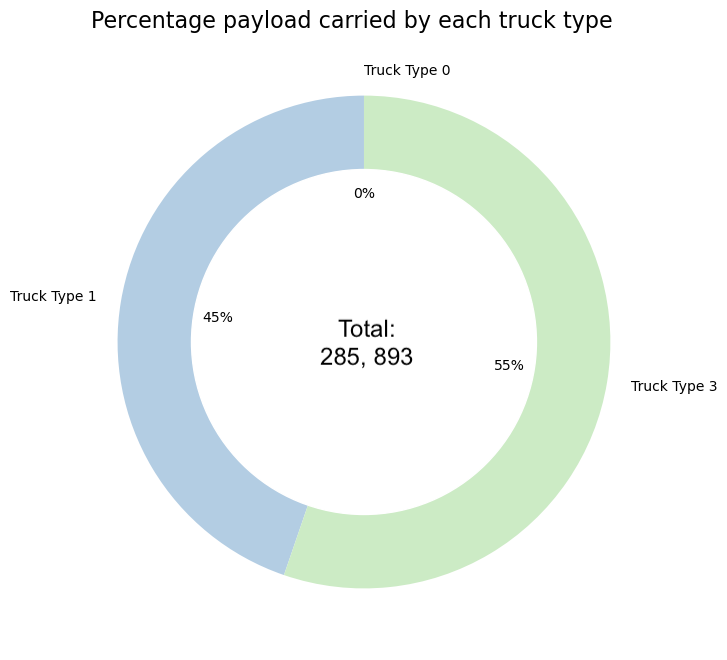
While analyzing the total payload transferred from shovels to dump sites, it was found that Truck Type 0 did not carry any material at all over the week's worth of data.
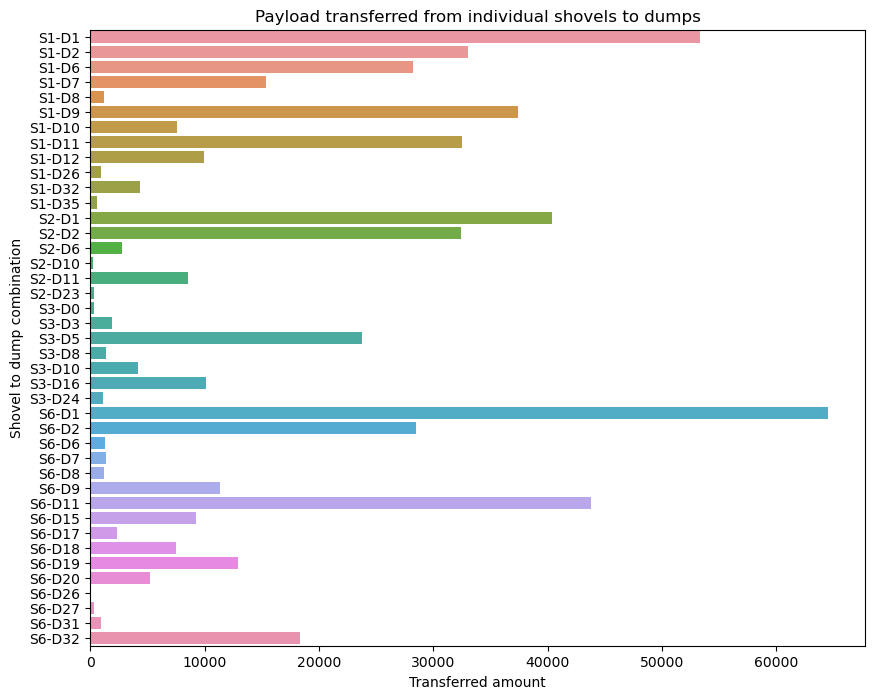
Data was analyzed by combinations of the 9 shovels to 36 dumps. Some routes (combinations) were unused and out of the existing routes, the trucks from Shovel 6 to Dump 1 and Shovel 1 to Dump 1 transferred the most payload.
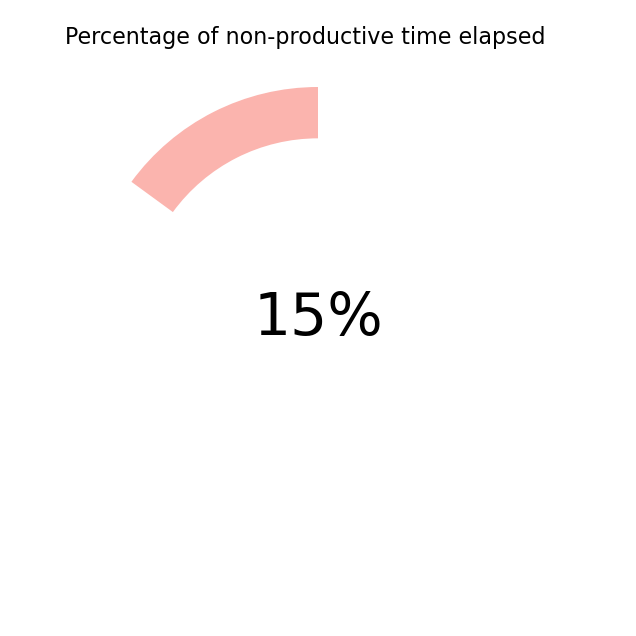
Out of the total time elaspsed for the dataset (approximately 7 days), around 15% of that time (~30 hours) was spent in the "non-productive" status.
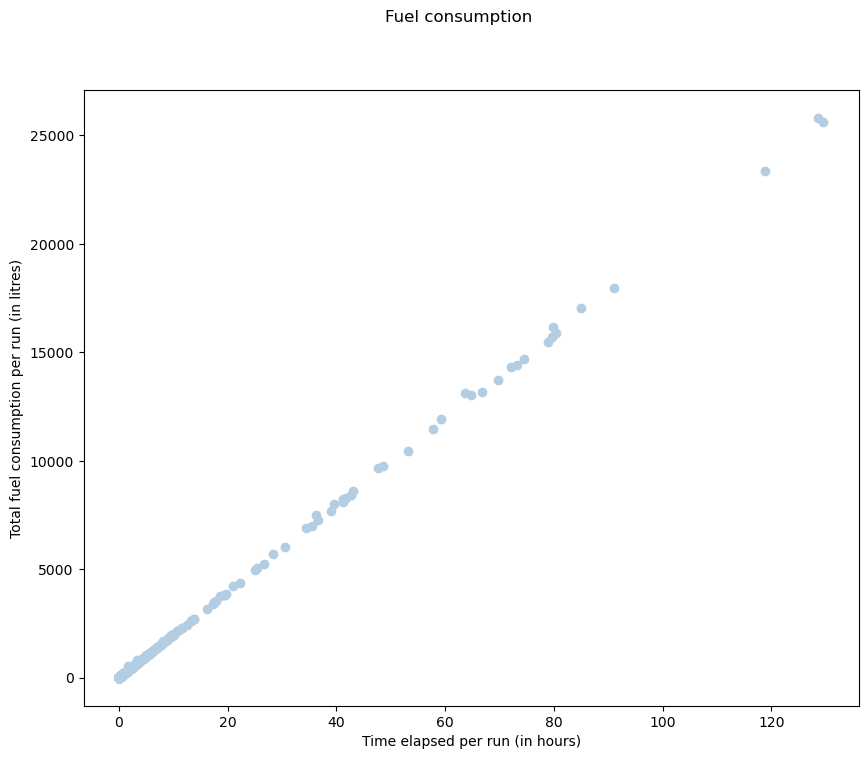
For each haul cycle, the average fuel rate and total time elapsed were calculated and plotted. A total of approximately 1,850,000 L of fuel was consumed.
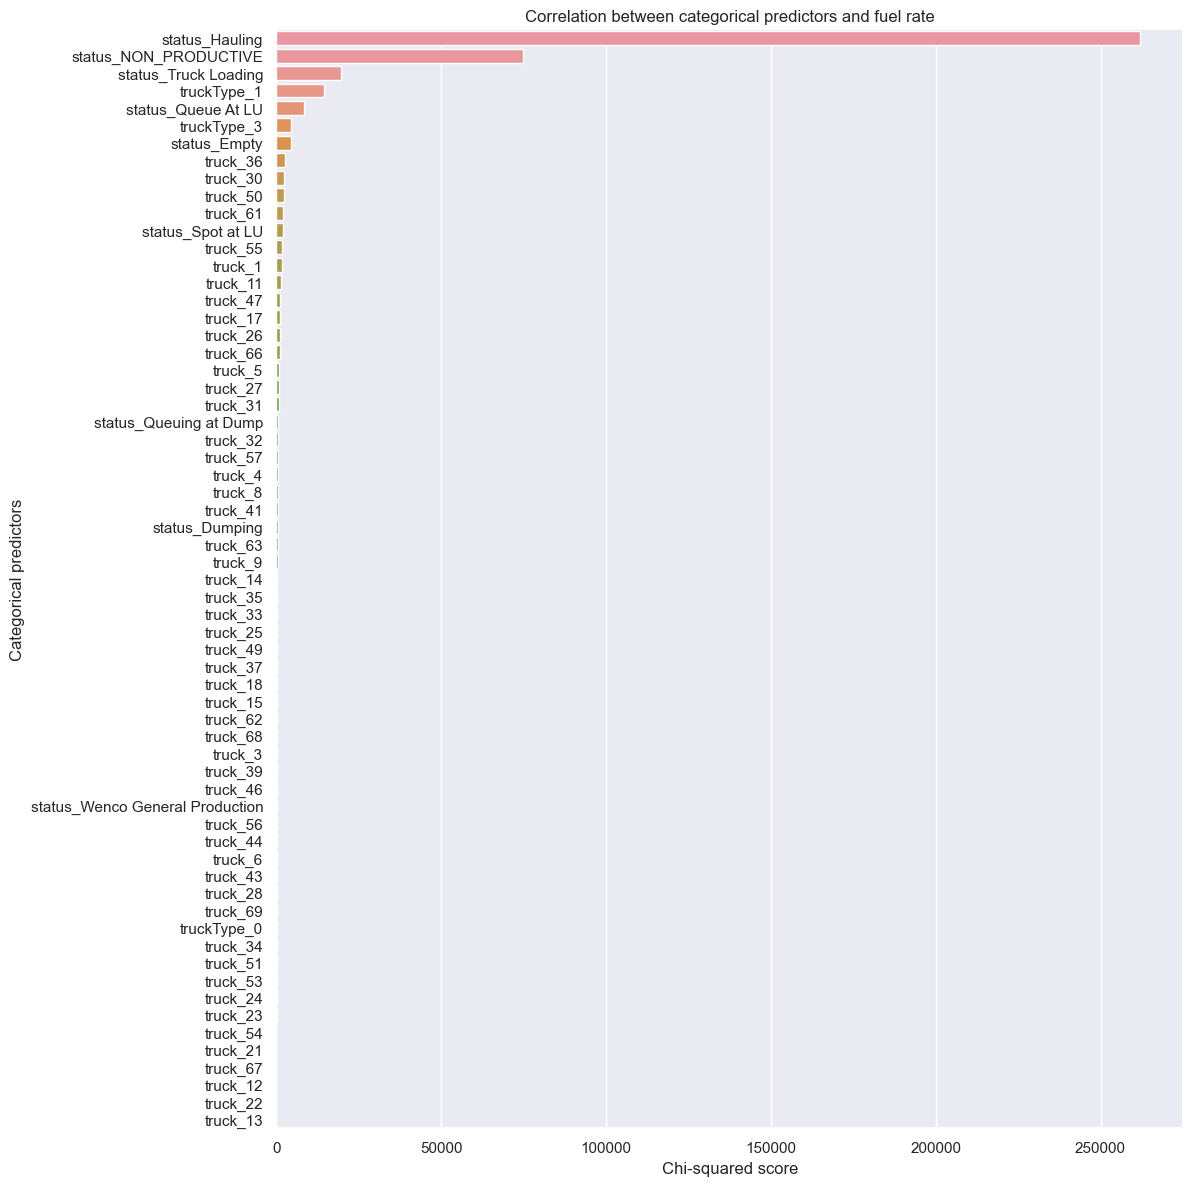
The chi-squared test was used to examine the correlations between categorical predictors and whether or not they would result in fuel rate above or below average.